Overview
Abstract
About Cisco Systems
Analytical objectives
Strategic Analysis
Analyzing the financial growth of the company
Margin Analysis
Economic Context Analysis
Financial Ratios Analysis
Measuring Performance
Measuring Efficiency
Measuring Risk
Measuring Liquidity
References
Appendix
Abstract
This essay aims to analyze and discuss Cisco Systems’ financial results over the last 5 years. It starts with a statement of the principal stakeholder group for whom the analysis is done and their likely information needs.
Then, it will analyze the strategic issues facing the company. And finally, analysis of Cisco’s current financial position and its ability to meet the challenges.
About Cisco Systems
CISCO SYSTEMS INC. is the worldwide leader in networking for the Internet.
The company was founded in 1984 by two computer scientists from Stanford University seeking an easier way to connect different types of computer systems.
Cisco Systems shipped its first product in 1986 and is now a multi-national corporation, with over 72,000 employees in more than 115 countries. Today, Cisco solutions are the networking foundations for service providers, small to medium business and enterprise customers which includes corporations, government agencies, utilities and educational institutions.
Cisco’s networking solutions connect people, computing devices and computer networks, allowing people to access or transfer information without regard to differences in time, place or type of computer system.
Cisco continues to grow through internal development, acquisitions, their global partnerships, and cross-functional teamwork. One area of their differentiated strategy includes a goal of growing each product category in their advanced technologies to capture $1 billion-plus in annual revenue and the number-one market position (Chambers 2008).
Cisco does not only provide networking products, but it build complete end to end solutions and architectures starting from basic routing and switching, to security, wireless, collaboration, data centers and video solutions.
Analytical objectives:
It’s important to point that this essay aims to analyze Cisco System’s financial position to shareholders. Information provided in this essay is to help shareholders in their decision-making whether to buy, sell or hold their shares.
Strategic Analysis
Cisco is a leading company in the IT industry; it’s crucial to the financial study to do strategic analysis for Cisco’s strengths, weaknesses, opportunities and threats. This essay will use SWOT analysis framework to do so.

As a summary for the above analysis, the following strategic issues may affect Cisco’s financial results in the coming period:
- Maintaining the market-share leadership needs regular improvements in the current products, which will affect the cost of sale.
- Innovating new products to capture market transition will affect the R&D budget and will affect the gross margins.
- The global political instability may affect the operating costs and hence the gross margins
- The global economic contexts instability “Tax, exchange rates and inflation rates…etc.” will affect the gross margins.
- Supply chain issues inside Cisco has to be solved, otherwise it may affect operating costs and hence the gross margins.
Analyzing the financial growth of the company:
It’s very clear from the below Income Statement comparison for the last five years that Cisco is well growing there revenue throughout the last 4 years. It also shows how Cisco was able to optimize their operating costs in 2012 and reduce it by 4%.
Cisco sell Products and Services, and they consider them as two separate organizations, that’s why it’s shown as two line items in the income statement. It’s clear that the Products organization generates more revenue, while Services organization is growing faster.
| 2012 | Variance | 2011 | Variance | 2010 | Variance | 2009 | Variance | 2008 | |
| Net sales | |||||||||
| Product | $36,326 | 5% | $34,526 | 6% | $32,420 | 11% | $29,131 | -12% | $33,099 |
| Services | $9,735 | 12% | $8,692 | 14% | $7,620 | 9% | $6,986 | 8% | $6,441 |
| Total Net Sales | $46,061 | 7% | $43,218 | 8% | $40,040 | 11% | $36,117 | -9% | $39,540 |
| Cost Of Sales | |||||||||
| Product | $14,505 | 6% | $13,647 | 17% | $11,620 | 11% | $10,481 | -10% | $11,660 |
| Services | $3,347 | 10% | $3,035 | 9% | $2,777 | 9% | $2,542 | 0% | $2,534 |
| Total Cost Of Sales | $17,852 | 7% | $16,682 | 16% | $14,397 | 11% | $13,023 | -8% | $14,194 |
| Gross Margin | $28,209 | 6% | $26,536 | 3% | $25,643 | 11% | $23,094 | -9% | $25,346 |
| Operating Expenses | |||||||||
| Research and Development | $5,488 | -6% | $5,823 | 10% | $5,273 | 1% | $5,208 | -2% | $5,325 |
| Sales and Marketing | $9,647 | -2% | $9,812 | 12% | $8,782 | 5% | $8,403 | -3% | $8,690 |
| General and Administration | $2,322 | 22% | $1,908 | -1% | $1,933 | 24% | $1,565 | 13% | $1,387 |
| Amortization Of Purchased Intangible Assets | $383 | -26% | $520 | 6% | $491 | -8% | $533 | 7% | $499 |
| Restructuring And Other Charges | $304 | -62% | $799 | N/A | $- | – | $63 | 2000% | $3 |
| Total Operating Expenses | $18,144 | -4% | $18,862 | 14% | $16,479 | 4% | $15,772 | -1% | $15,904 |
| Operating Income | |||||||||
| Interest Income | $650 | 1% | $641 | 1% | $635 | 27% | $499 | -39% | $824 |
| Interest Expense | $596 | -5% | $628 | 1% | $623 | 387% | $128 | 1064% | $11 |
| Other Income, net | $40 | -71% | $138 | -42% | $239 | N/A | $- | – | $- |
| Total Operating Income | $94 | -38% | $151 | -40% | $251 | -32% | $371 | -54% | $813 |
| INCOME BEFORE PROVISION FOR INCOME TAXES | $10,159 | 30% | $7,825 | -17% | $9,415 | 22% | $7,693 | -25% | $10,255 |
| Provision For Income Taxes | $2,118 | 59% | $1,335 | -19% | $1,648 | 6% | $1,559 | -29% | $2,203 |
| NET INCOME | $8,041 | 24% | $6,490 | -16% | $7,767 | 27% | $6,134 | -24% | $8,052 |
| Net Income Per Share | |||||||||
| Basic | $1.50 | 28% | $1.17 | -14% | $1.36 | 30% | $1.05 | -22% | $1.35 |
| Diluted | $1.49 | 27% | $1.17 | -12% | $1.33 | 27% | $1.05 | -20% | $1.31 |
| Shares Used In Per-Share Calculation | |||||||||
| Basic | 5,370 | -3% | 5,529.00 | -4% | 5,732 | -2% | 5,828 | -3% | 5,986.00 |
| Diluted | 5,404 | -3% | 5,563.00 | -5% | 5,848 | 0% | 5,857 | -5% | 6,163.00 |
| Cash Dividends Declared Per Common Share | $0.28 | 133% | $0.12 | N/A | $- | – | $- | – | $- |
Table 1. Cisco Income Statement Comparison
Margin Analysis:
Marginal analysis is an important way for decision-making in the business world. Marginal analysis measures the additional benefits of one production activity versus its costs. This analysis can help the shareholder to understand whether an activity is profitable and thus make a decision based on that information.
The following margin ratios give a clue as to the financial structure of the business and its exposure to business risk.

Figure 1. Cisco Margin Analysis
The above graph “Figure 1” shows that there’s a slight improvement in the different profit margins in 2012 than in 2011, which reflect general enhancements and cost optimizations done in that year, but it also shows the economy effect on the company profit margins, as it’s lower than what it had in 2008 and 2010.
Decreasing gross profit margins is due to the higher discounts given for the products and services as a response to the economy slow down and the increased competition.
Cisco started to distribute dividends in 2011, which decreased the retained profit margins as shown in the graph.
Economic Context Analysis:
As Cisco Systems part of the wider economy, both contribute to and is affected by the prevailing economic conditions. A significant influence upon the performance of Cisco is the general level of economic activity, exchange rates, taxation, interest rates, and inflation rates.
Cisco is operating in around 117 countries, which make it difficult to provide comprehensive economic context analysis, however most of its revenue is coming from the Americas region as shown below in (Table 2) “number in millions, except percentages”:
| Region | 2012 | 2011 |
| Americas | $26,501 | $25,015 |
| Percentage of net sales | 57.5% | 57.9% |
| EMEA | $12,075 | $11,604 |
| Percentage of net sales | 26.2% | 26.8% |
| APJC | $7,485 | $6,599 |
| Percentage of net sales | 16.3% | 15.3% |
| Total | $46,061 | $43,218 |
Table 2. Cisco earnings per region.
Based on the IMF economic outlook report “May 2013” for the western hemisphere region, the average GDP growth for the Americas in 2012 was 2.85% and the average inflation rates in 2012 was 4.36%. The following economic context analysis for the Americas shows how Cisco’s financial position is aligned with the GDP growth and the inflation rates

Figure 2. Cisco Americas revenue comparison
Cisco Americas sales revenue in 2012 has increased at a significantly faster rate than inflation and GDP growth. Cisco Americas sales revenue growth was around 6% which implies that there has been a real increase in the volume of products and services sold as opposed to simply charging customers more for the same level of sales.
Financial Ratios Analysis:
There are number of schemes for categorizing and analyzing ratios, this essay is focusing on a particular framework for classifying these ratios which classifies them as a measuring performance (P), efficiency (E), risk (R) and liquidity (L). This framework is referred to as PERL.
In addition to the PERL framework, some other ratios are very important to the shareholders in specific, these ratios include the following:
. Earnings per share (E.P.S): The below graph “Figure 3” shows that Cisco’s earnings per share in 2012 was the highest in the past 5 years, usually the more earnings per share reflect the more dividends can be distributed to shareholders.

Figure 3. Cisco EPS comparison.
. Price/ Earnings (P/E) ratio: The following graph “Figure 4” shows the evolution of the P/E ration which measures the market price of the share as a proportion of the earnings per share.
Usually, the higher the P/E ratio, then the higher the expectations of the company’s future profitability, However it does not tell the full story as it has to be compared with the competitors…It’s obvious from the below graph that P/E ratio has fallen over time, while the above figures show that earnings steadily rise, it is a sign that price has not proportionately increased with earnings.

Figure 4. Cisco P/E comparison
. Dividend per share: This measures the amount of the dividends that the company actually paid to its shareholders, Cisco started to pay dividends in 2011.

Measuring Performance:
Basically, the performance of Cisco business can measured by the efficiency by which it converts various financial inputs such as capital employed or sales turnover into profit. There are other less direct measures of performance that is out of this essay’s scope.
. Margin ratio: This ratio was discussed under the margin analysis section above. It measures the amount of sales being captured by the firm as profit.
It’s important to add to the above profit margin analysis the operating cost to sales ratio, which seems to be enhanced in the last according to Figure 6.

Figure 6. Cisco operating cost to sales.
. Return on total capital employed (ROCE): It is the principle return measure that can be derived from the accounts. It measures the return of profit on all of the capital invested in the business including long-term loans, preference capital and equity.
.
| 2012 | 2011 | 2010 | 2009 | 2008 | |
| Long-term borrowing | 16,297.00 | 16,234.00 | 12,188.00 | 10,295.00 | 6,393.00 |
| Total equity | 51,301.00 | 47,259.00 | 44,285.00 | 38,677.00 | 34,402.00 |
| Profit before tax | 10,159.00 | 7,825.00 | 9,415.00 | 7,693.00 | 10,255.00 |
| ROCE | 15% | 12% | 17% | 16% | 25% |
Table 3. Cisco ROCE components.

Figure 7. Cisco ROCE comparison.
Figure 7 reflects the same results in the above profit margin analysis in Figure 1, where it shows slight performance improvement in 2012 than in 2011 but still lower than what it used to be in 2008 and 2010.
Measuring Efficiency:
Less direct efficiency (E) measures can reflect how a business is performing. There are multiple ratios to measure efficiency of a company; this essay will mention only the Cost Efficiency Ratio.
. Cost efficiency ratio (CER): Cost efficiency ratio measures the ratio of actual cost to predicted cost.
| 2011 | 2012 predicted | 2012 actual | CER | |
| Cost of sale | $ 16,682.00 | $ 17,779.39 | $ 17,852.00 | 1.00 |
| Net Operating expenses | $ 18,862.00 | $ 20,102.79 | $ 18,144.00 | 0.90 |
Table 4. Cisco Cost Efficiency Ratio Calculation.
From the above Table 4, the CER calculations for Cisco shows that the cost of sale has not been improved from 2011 to 2012, where a clear improvement is shown in the operating costs.
Measuring Risk:
There are different types of risk rations that a stakeholder might consider important like market risk and firm-specific risk. This essay is focusing on financial risk and specifically the gearing ratio.
. Gearing ratio: This ratio measures the relationship of long-term borrowing to the total capital employed invested in the business.
| 2012 | 2011 | 2010 | 2009 | 2008 | |
| Long-term borrowing | 16,297.00 | 16,234.00 | 12,188.00 | 10,295.00 | 6,393.00 |
| Total equity | 51,301.00 | 47,259.00 | 44,285.00 | 38,677.00 | 34,402.00 |
| Gearing ratio | 24% | 26% | 22% | 21% | 16% |
Table 5. Cisco gearing ratio comparison.
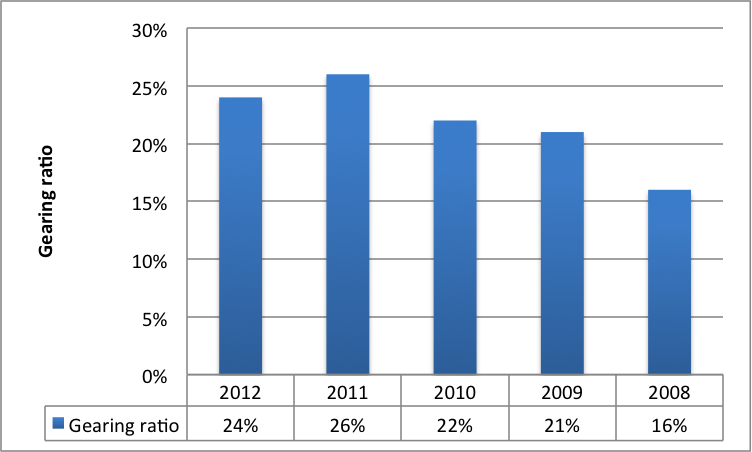
Figure 8. Cisco gearing ratio.
The above data from Table 5 and Figure 8 shows represent modest decrease in gearing in 2012 than in 2011, mostly brought about because the company’s increasing profitability is increasing the value of the owner’s equity in the balance sheet at a faster rate than the company’s increase in borrowing.
Measuring Liquidity:
Measuring Liquidity is important to reflect the company’s ability to cover its short-term liabilities using short-term resources.
. Current asset ratio: This ratio reflects how the current inventories, receivables and cash can cover the short-term liabilities.
| 2012 | 2011 | 2010 | 2009 | 2008 | |
| Current Assets | $61,933.00 | $57,231.00 | $51,421.00 | $44,177.00 | $35,699.00 |
| Current Liabilities | $17,731.00 | $17,506.00 | $19,233.00 | $13,655.00 | $13,858.00 |
| CAR | 3.49 | 3.27 | 2.67 | 3.24 | 2.58 |
Table 6. Cisco Current Asset Ratio Comparison.
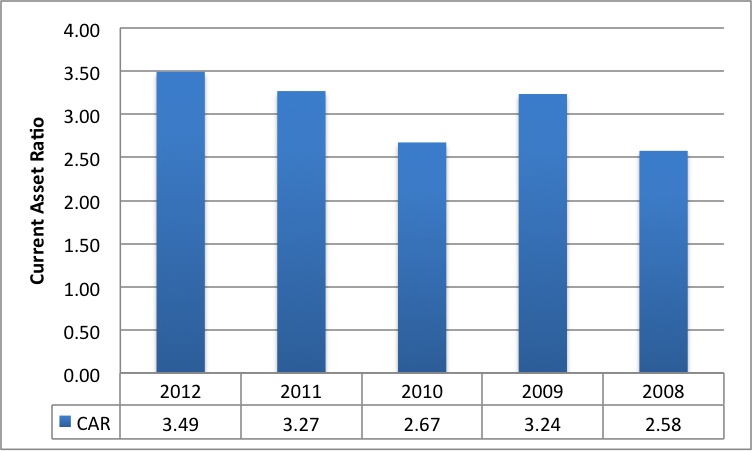
Figure 9. Cisco Current Asset Ratio Comparison.
The above Table 6 and Figure 9 show Cisco’s ability to cover the current liabilities, it is obvious that Cisco has huge amount of cash and current assets that make it capable to cover the current liabilities as well as re-investing some cash and distribute dividends.
References:
- Bob Ryan (2008). Finance and accounting for business, second edition (chapter 7). Cangage Learning EMEA.
- Cisco (2002) Cisco Undertakes the Largest IP Telephony Deployment in Industry History [online] available from
<http://www.cisco.com/web/about/ciscoitatwork/downloads/ciscoitatwork/pdf/cisco_ip_telephony.pdf >
- Cisco (n.d) Visual Networking Index [online] available from
<http://www.cisco.com/en/US/netsol/ns827/networking_solutions_sub_solution.html#~usage >
- Yahoo Finance (2013) Cisco Systems, Inc. Stock Chart [online] available from
- S-Cool (n.d) Shareholder Ratios [online] available from
< http://www.s-cool.co.uk/a-level/business-studies/ratio-analysis/revise-it/shareholders-ratios>
- IMF (2013) Regional Economic Outlook for Western Hemisphere [online] available from
< http://www.imf.org/external/pubs/ft/reo/2013/whd/eng/pdf/wreo0513.pdf>
- Cisco (2008) Cisco Annual Report 2008 [online] available from
- Cisco (2009) Cisco Annual Report 2009 [online] available from
<http://www.cisco.com/assets/cdc_content_elements/docs/annualreports/media/2009-ar.pdf>
- Cisco (2010) Cisco Annual Report 2010 [online] available from
<https://materials.proxyvote.com/Approved/17275R/20100920/AR_67529/HTML2/default.htm>
- Cisco (2011) Cisco Annual Report 2011 [online] available from
<https://materials.proxyvote.com/Approved/17275R/20111010/AR_104291/HTML2/default.htm>
- Cisco (2012) Cisco Annual Report 2012 [online] available from
<https://materials.proxyvote.com/Approved/17275R/20120917/AR_142319/>
Appendix:
Cisco Balance Sheet Comparison:
| 2012 | Variance | 2011 | Variance | 2010 | Variance | 2009 | Variance | 2008 | |
| Assets | |||||||||
| Current Assets | |||||||||
| Cash | $9,799 | 27.9% | $7,662 | 67.3% | $4,581 | -19.9% | $5,718 | 10.2% | $5,191 |
| Financing Receivables, net | $3,661 | 17.7% | $3,111 | 35.1% | $2,303 | N/A | $- | – | $- |
| Investments | $38,917 | 5.4% | $36,923 | 4.7% | $35,280 | 20.5% | $29,283 | 39.2% | $21,044 |
| Accounts Receivable | $4,369 | -7.0% | $4,698 | -4.7% | $4,929 | 55.1% | $3,177 | -16.9% | $3,821 |
| Inventory | $1,663 | 11.9% | $1,486 | 12.0% | $1,327 | 23.6% | $1,074 | -13.0% | $1,235 |
| Deferred Tax Assets | $2,294 | -4.8% | $2,410 | 13.4% | $2,126 | -8.4% | $2,320 | 11.8% | $2,075 |
| Other Current Assets | $1,230 | 30.7% | $941 | 7.5% | $875 | -66.4% | $2,605 | 11.7% | $2,333 |
| Total Current Assets | $61,933 | 8.2% | $57,231 | 11.3% | $51,421 | 16.4% | $44,177 | 23.7% | $35,699 |
| Investments | $- | – | $- | – | $- | – | $- | – | $- |
| Property, Plant and Equipment | |||||||||
| Equipment and Property | $3,402 | -13.1% | $3,916 | -0.6% | $3,941 | -2.5% | $4,043 | -2.6% | $4,151 |
| Property, Plant and Equipment – Net | $3,402 | -13.1% | $3,916 | -0.6% | $3,941 | -2.5% | $4,043 | -2.6% | $4,151 |
| Intangible Assets | |||||||||
| Goodwill | $16,998 | 1.1% | $16,818 | 0.9% | $16,674 | 29.0% | $12,925 | 4.3% | $12,392 |
| Purchased Intangible Assets | $1,959 | -22.9% | $2,541 | -22.4% | $3,274 | 92.4% | $1,702 | -18.5% | $2,089 |
| Total Intangible Assets | $18,957 | -2.1% | $19,359 | -3.0% | $19,948 | 36.4% | $14,627 | 1.0% | $14,481 |
| Other Assets | $7,467 | 13.3% | $6,589 | 13.2% | $5,820 | 10.2% | $5,281 | 19.9% | $4,403 |
| Total Assets | $91,759 | 5.4% | $87,095 | 7.4% | $81,130 | 19.1% | $68,128 | 16.0% | $58,734 |
| 2012 | Variance | 2011 | Variance | 2010 | Variance | 2009 | Variance | 2008 | |||||||||
| Liabilities | |||||||||||||||||
| Current Liabilities | |||||||||||||||||
| Short-term Debt. | $31 | -94.7% | $588 | -81.0% | $3,096 | N/A | $- | $- | $500 | ||||||||
| Accounts Payable | $859 | -1.9% | $876 | -2.1% | $895 | 32.6% | $675 | -22.3% | $869 | ||||||||
| Accrued Compensation | $2,928 | -7.4% | $3,163 | 1.1% | $3,129 | 23.4% | $2,535 | 4.4% | $2,428 | ||||||||
| Deffered Revenue | $8,852 | 10.3% | $8,025 | 4.7% | $7,664 | 19.0% | $6,438 | 3.9% | $6,197 | ||||||||
| Taxes Payable | $276 | 130.0% | $120 | 33.3% | $90 | -45.8% | $166 | 55.1% | $107 | ||||||||
| Other Current Liabilities | $4,785 | 1.1% | $4,734 | 8.6% | $4,359 | 13.5% | $3,841 | 2.2% | $3,757 | ||||||||
| Total Current Liabilities | $17,731 | 1.3% | $17,506 | -9.0% | $19,233 | 40.8% | $13,655 | -1.5% | $13,858 | ||||||||
| Long Term Liabilities | |||||||||||||||||
| Long-term Debt. | $16,297 | 0.4% | $16,234 | 33.2% | $12,188 | 18.4% | $10,295 | 61.0% | $6,393 | ||||||||
| Other Long-term Liabilities | $6,430 | 5.5% | $6,096 | 12.4% | $5,424 | -1.4% | $5,501 | 34.8% | $4,081 | ||||||||
| Total Long Term Liabilities | $22,727 | 1.8% | $22,330 | 26.8% | $17,612 | 11.5% | $15,796 | 50.8% | $10,474 | ||||||||
| Total Liabilities | $40,458 | 1.6% | $39,836 | 8.1% | $36,845 | 25.1% | $29,451 | 21.0% | $24,332 | ||||||||
| Stockholders Equity | |||||||||||||||||
| Common Stock | $39,271 | 1.6% | $38,648 | 2.3% | $37,793 | 10.0% | $34,344 | 2.5% | $33,505 | ||||||||
| Retained Earnings | $11,354 | 55.9% | $7,284 | 24.5% | $5,851 | 51.3% | $3,868 | 3123.3% | $120 | ||||||||
| Accumulated Other Comprehensive Income | $661 | -48.9% | $1,294 | 107.7% | $623 | 43.2% | $435 | -40.2% | $728 | ||||||||
| Total Stockholders Equity | $51,286 | 8.6% | $47,226 | 6.7% | $44,267 | 14.5% | $38,647 | 12.5% | $34,353 | ||||||||
| Non Controlling Interest | $15 | -54.5% | $33 | 83.3% | $18 | -40.0% | $30 | -38.8% | $49 | ||||||||
| Total Equity | $51,301 | 8.6% | $47,259 | 6.7% | $44,285 | 14.5% | $38,677 | 12.4% | $34,402 | ||||||||
| Total Liability & Stockholders Equity | $91,759 | 5.4% | $87,095 | 7.4% | $81,130 | 19.1% | $68,128 | 16.0% | $58,734 | ||||||||

Since the admin of this site is working, no hesitation very shortly it will be renowned,
due to its feature contents.